Publisher's Synopsis
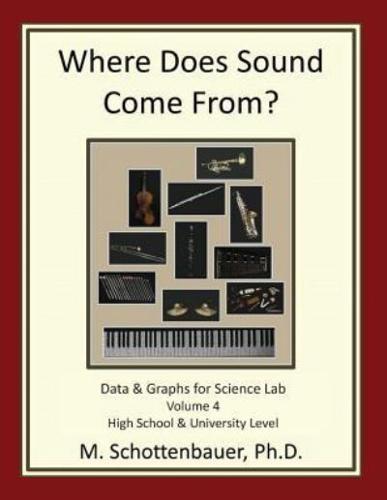
In this book, readers gain access to real scientific data pertaining to the science of sound production, promoting graph-reading, comparison, contrast, and calculation skills. Graphs show data from a Sound Pressure Meter (Microphone). This book contains data collected from a violin, alto recorder, flute, clarinet, and trumpet. Graphs display the tone quality associated with correct and incorrect techniques on these instruments. Also demonstrated in graphs are various common articulations (legato, staccato, accent, tenuto) and bowing techniques (legato, spiccato, pizzicato, accents, and clicks), with differences between steel core are perlon core strings as a focus for discussion. Later sections of the book elucidate common elements of phrasing and style, such as two-note slurs and short phrases, with graphical analysis. A final section includes graphs of short musical phrases without explanation, for readers to analyze. Bonus Material: Appendices include reprints of reference materials from Volume 1 for convenience, including comparison data, graphs of data for different types of microphone setups (mono, stereo, traditional stereo, &, x-y configuration) and graphs of theoretically calculated harmonic waves.


